VINAY MARURI – MARCH 5TH, 2019
State level minimum wages have been a hot economic topic recently, as voters in Arkansas and Missouri approved measures this month to raise the minimum wages in those states to $11/hour and $12/hour respectively. In fact, according to the Economic Policy Institute, 21 states and the District of Columbia have raised their state minimum wages since January 2014. The main reason for this is that the federal minimum wage, last raised in 2009, has not kept up with inflation and rising costs of living, leaving many families to earn poverty wages according to a Government Accountability Office (GAO) study released in October 2017. The report found that 40% of the U.S. workforce earned less than $16/hour and that most of these households were impoverished even with the use of federal social safety net programs.
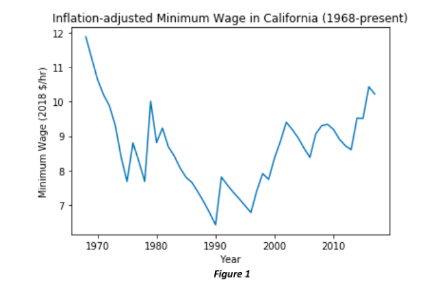
One of the states that raised their minimum wage was California. In November 2016, voters overwhelmingly approved a plan to raise the minimum wage in California from $10/hour to $15/hour, in increments, from 2017 to 2022. These incremental raises were motivated by a desire to give low-income workers a pay increase without overburdening businesses with the rapidly increasing costs of labor. California’s plan should increase the purchasing power of households with minimum wage earners, and address the erosion of purchasing power among minimum wage earning Californians, which peaked in 1968, as shown in figure 1 below.
However, despite the increases in the minimum wage, California still has the highest poverty rate in the nation, according to a Census Bureau report released in September. At 19%, almost 1 in 5 Californians live in poverty, struggling to get by. This is largely due to the high costs of living in the state, as housing, gasoline, food, and tax costs in California are some of the highest.
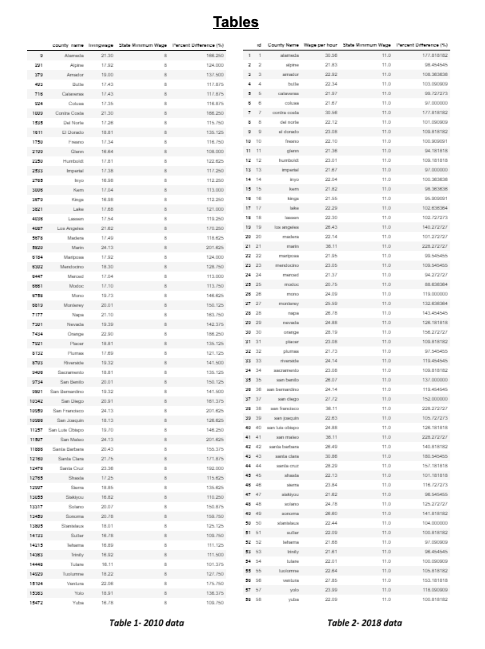
Furthermore, as Tables 1 and 2 show, the costs of living differ significantly throughout the state. Using data gathered from the MIT Living Wage model, which generates a living wage estimate for a family to meet the minimum costs of necessities such as food, childcare, housing, transportation, healthcare and other basic goods, a pattern emerges of higher costs of living in urban counties with medium to large cities, and lower costs of living in rural counties with smaller towns. This pattern is not isolated to the San Francisco Bay Area or the Los Angeles Metropolitan Area. For the average American household of two adults and one child, one adult would have to earn $26.49/hour working a full-time job (40 hours/week) to provide that household with a livable wage in Santa Barbara County, located about 100 miles from the Los Angeles metro area. This estimated living wage rate is lower than that of neighboring Ventura County, and the same as that of Los Angeles County, both of which are part of the Los Angeles metro area. In fact, in every county of California, a worker would have to earn between $21 and $36 per hour to provide the average household with a livable wage, according to the MIT Living Wage model.
Given that the minimum wage is only scheduled to rise to $15/hour by 2022, California’s minimum wage plan will not provide households across the state with a livable wage, and in some counties may not even provide a livable wage for households with two adults working minimum wage jobs. A change in minimum wage policy is needed to lower adult and child poverty rates in California.
One possible way to do this would be to set minimum wage rates on the county level rather than on the state level. The idea behind this proposal is to account for the cost of living differences across California, while setting wage rates to cover those costs. Intuitively, the same income will cover more expenses in Fresno, which has lower costs of living, than in San Francisco, which has some of the highest costs of living in the nation.
To test this idea, we present a linear regression model, predicting the percent difference between a county’s living wage and the state minimum wage using two variables. First, a variable for county-level poverty rates from 2016 and second, an indicator variable to denote whether a county was rural or urban using the federal government’s definition of rural and urban counties. The model is specified formally as:
![]()
where y is the predicted percent difference, X1 is the poverty rate variable, and X2 is the urban/rural indicator variable.
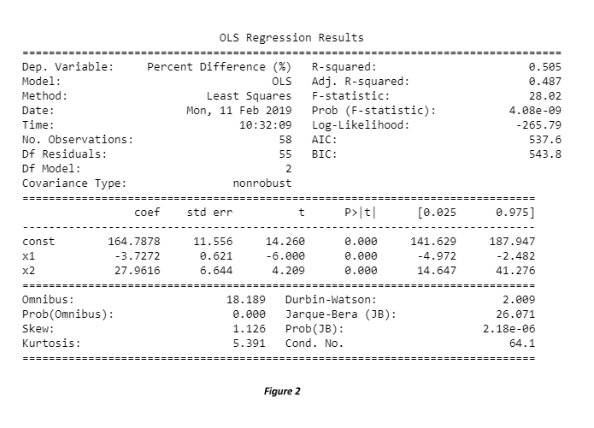
The results of the regression show that a rural county with a high poverty rate should have a low percent difference between its estimated living wage and the state minimum wage, whereas a low-poverty and urban county should have a high percent difference. This regression result means that the booming urban areas of California are predicted to be expensive to live in. Our results also show that urban counties have higher differences between the state minimum wage and the estimated hourly wage a worker would need to make to provide for a family living at a bare subsistence level.
The regression results, as shown in figure 2, show that both variables, poverty rate and the urban/rural indicator variable, have statistically significant effects on the predicted percent difference between a county’s living wage and the state minimum wage.
On a policy level, the data in tables 1 and 2 show that the current minimum wage in California, as well as the scheduled increases, are insufficient for the minimum wage households in California to earn a livable wage without the risk of living in poverty. Furthermore, the regression results confirm that the different counties of California would benefit from setting different minimum wage rates, as such a policy would have an appreciable effect in accounting for the different characteristics of the counties.
Setting minimum wage rates at the county level could reduce poverty rates while not forcing bankruptcy for businesses that cannot afford to pay San Francisco wages to their employees in Bakersfield. County by county minimum wages would be a more tailored approach to the problem of poverty in California than a flat minimum wage across the state.
Featured Image Source: Forbes
Disclaimer: The views published in this journal are those of the individual authors or speakers and do not necessarily reflect the position or policy of Berkeley Economic Review staff, the Undergraduate Economics Association, the UC Berkeley Economics Department and faculty, or the University of California, Berkeley in general.