
JEFFREY SUZUKI – OCTOBER 28TH, 2019 EDITORS: HOWARD YAN AND SHAWN SHIN
A Brief Primer to American Foreign Policy
In his book The Great Delusion: Liberal Dreams and International Realities, John J. Mearsheimer argues that for over a century, the sentiment that America has a moral obligation to play an active role in crusading for democracy across the globe has been a recurring theme. For example, President Theodore Roosevelt, proclaimed, “to be safe democracy must kill its enemy when it can and where it can. The world cannot be half democratic and half autocratic.”1 In the midst of the Vietnam War, Secretary of State Dean Rusk declared that the “United States cannot be secure until the total international environment is ideologically safe.”2 This crusader’s mentality is perhaps best encapsulated by The Bush Doctrine of 2002, wherein “by the resolve and purpose of America, and of our friends and allies, we will make this an age of progress and liberty. Free people will set the course of history, and free people will keep the peace of the world.”3 In the following year, the United States invaded Iraq and toppled Suddam Hussein’s regime.
These rallying cries for crusade can all be considered examples of leaders using what would eventually be known as “democratic peace theory” in their rhetoric—the idea that spreading democracy across the world leads to more peace and stability. According to Professor Mearsheimer, advocates of the theory often posit three main points: first, democracies are averse to waging war because constituents pay its price and control the government; secondly, democracies tend to be friendly toward other democracies; lastly, democracies tend to be economically interdependent and the economic costs of war discourages conflict.4 The theory concludes that populating the globe with democratic governments dissuades conflicts that would otherwise occur in a world with many authoritarian governments. By this logic, promoting democracy is a win-win situation for the United States—we oblige the oppressed and mangled masses in their quest for freedom as we foster a more peaceful world.
If true, one would expect the US to be a paragon of peace after democratic capitalism triumphed over authoritarian communism following the fall of the Soviet Union in 1991. However, as Mearsheimer also argues, ever since the US secured its place as a true democratic and liberal hegemony, the US has engaged in seven wars since the end of the Cold War, all of which it initiated.5 Whether it be a lengthy list of CIA-backed coups in countries like Chile and Guatemala, or military invasions involving thousands of personnel in Vietnam and Grenada, Americans have demonstrated a tendency towards intervention in the past century.
According to New York University professors of politics George W. Downs and Bruce Bueno de Mesquita, out of more than 35 American interventions in developing countries between the end of WWII and the War on Terror, there has only been one unambiguous case that has been successful at helping foster a fully-consolidated democracy within 10 years of intervention: Colombia after the US intervention during its War on Drugs; this represents a success rate of less than 3%. Another account by Jeffrey Pickering and Mark Peceny claims that out of all American military interventions, the only intervention that fully succeeded in fostering a complete democracy was when the US overthrew the military dictatorship in Panama in 1989. As we can see, what constitutes a “successful” intervention varies depending on definition and perspective.
Additionally, the US does not always interfere under the auspices of promoting democracy. Sometimes it intervenes to mount its War on Drugs, as in the case of Columbia. In other cases, the US government intervenes in secrecy, running elaborate “deception campaigns” to withhold information that might weaken public opinion, an example being the US support of the Contras in Nicaragua.
In summation, the US has a questionable success rate in these interventions. So, we ask two questions: first, how often does the US, at the very least, intervene to protect or promote democracy; and secondly, how could such interventions impact economic growth in the affected areas? To narrow the scope of this broad question, we first turn our attention to regime changes in 20th century Latin America first, a region quite familiar with American influence and intervention.
American Regime in Latin America: Methodology
Before we perform our analysis, we acknowledge that it is impossible to gather data on countries that experienced intervention as though intervention never occurred. For example, because Chile did undergo a coup in 1973, we cannot observe a Chile that did not undergo a coup. In other words, counterfactuals are unobservable.
In the case where data for a country is scarce or unavailable, economists sometimes assume that the country has similar data to the regional average. For example, the Global Inequality Report of 2018 estimates the level of inequality in Malaysia, whose distribution of income was unavailable, by assuming that it has the same overall inequality as that of its region, shared with China and India.
In our case, we estimate the counterfactual by taking the average GDP growth rate of the country’s geopolitical region sans the country in which the US intervened. We considered using the remainder of Latin America and the Caribbean as our counterfactual; however, the continent is too large and variable in terms of economic performance from region to region to be a reasonable comparison.
To observe economic effects, we use GDP growth data from the World Bank, which adjusts for inflation by pricing all goods in 2010 US dollars. We wish to observe at least 5 years of economic data prior to the attempted regime change because we wish to understand the economic trend of a country before the attempted regime change.
Therefore, because World Bank data begins at 1961, we can only analyze cases that start from 1966 at the earliest to observe 5 years of economic growth prior to US intervention. Unfortunately, the 1961 start date entails that we leave a number of important regime changes out of our analysis.
Chile in 1973:
Primer:
According to the CIA’s own website, Nixon authorized 10 million dollars to prevent Salvador Allende from coming to power. Worried that the constitutionalist General René Schneider would prevent the coup from happening, the CIA sought plotters to subdue him. In a botched kidnapping which the CIA denies involvement in, assailants killed Schneider as he attempted to defend himself. Democratically elected President Salvador Allende was later overthrown by US-armed coup supporters. President Allende was thought to have committed suicide as the military entered his office. The following Augusto Pinochet regime killed thousands and imprisoned tens of thousands. This ended four decades of Chilean democracy. This is an example of a US intervention that was explicitly anti-democratic.
We compare Chile to average Southern Cone growth rates (Argentina and Uruguay).
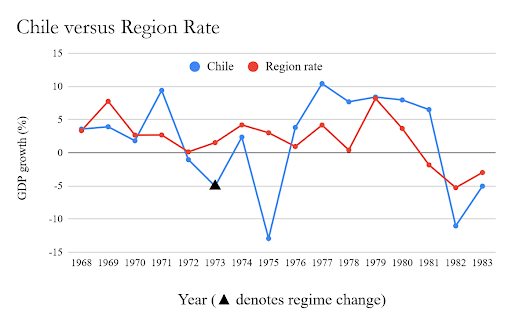
Note: Data for Chilean and regional growth rate from World Bank (2019) | Graph by Jeffrey Suzuki
Graph in Context:
Chile’s growth rate dropped from about 9.4% in 1971 to -5% in 1973. This indicates that there was already economic instability before the time of crisis.
Notably, CIA efforts to destabilize the Chilean Regime began in 1970. The CIA’s website alleges that “after Allende’s election and before his inauguration, the CIA, under 40 Committee direction, made an effort—in coordination with the Embassy in Santiago—to encourage Chilean businesses to carry out a program of economic disruption;” “to prevent another Cuba” under President Allende, “in addition to political action, Nixon and Kissinger […] ordered steps to ‘make the economy scream.” While we do not exactly know the details of this economic sabotage, it might have been successful—growth plummeted by about 14.4% two years leading up to the coup. Economic distress may have played a role in further destabilizing the government, ripening it for a successful coup.
Relative Performance of Chile compared to the Region:
We measure relative performance by observing changes in average growth rates in our observed country and the regional average.
We denote five years prior to regime change as period 1 and ten years after regime change as period 2.
In period 1, Chile’s average growth rate was about 3.55%.
In period 2, its average growth rate fell to 1.21%, representing a drop of 2.34%.
Meanwhile, in period 1, the region’s growth rate was about 3.33%.
In period 2, its average growth rate fell to 1.48%, representing a drop of about 1.85%.
Overall, Chile’s growth rate fell 0.48% more than the change in the regional average, signaling poor relative economic performance.
Growth oscillates for the first three years after the Pinochet Regime comes to power, before making a seeming recovery. From 1976-1981, it has five years of strong economic growth, averaging roughly 7.5% annually.
However, in 1982, the military government of Chile passed economic reforms that are thought to be the cause of a recession—the Crisis of 1982. Chile’s unemployment rate rose to about 13%. This recession, in conjunction with the initial destabilization of the Pinochet Regime, is responsible for Chile’s poor economic performance relative to the region.
Argentina in 1976:
Primer:
Secretary of State Henry Kissinger gave urgent approval to Argentine military coup leaders to overthrow democratically elected leader Isabel Perón, assuring US support for the following regime. While US support was not exactly financial nor military, the US was the regional hegemony of the western hemisphere—assurances of support by a regional hegemony should be considered meaningful. The following “Dirty War” would kill an estimated 30,000 people. This conflict would last until 1983. This is another example of a US intervention that was explicitly anti-democratic.
We compare Argentina to average Southern Cone growth rates (Chile and Uruguay).
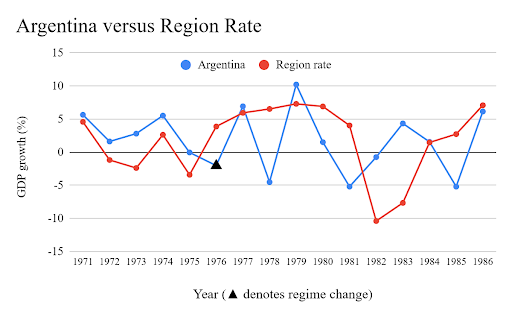
Note: Data for Argentine and regional growth rate from World Bank (2019) | Graph by Jeffrey Suzuki
Graph in Context:
Before the regime change, we can see that Argentine and regional growth rates resemble one another.
Argentina’s “dirty war” took place from 1976 to 1983. During this time, as we can observe above, Argentine growth fluctuates quite a bit, occasionally peaking above and below the regional rate. The economic effects of devastation are not clear from a glance.
Relative Performance of Argentina compared to the Region:
We measure relative performance by observing changes in average growth rates in our observed country and the regional average.
In period 1, Argentina’s average growth rate was about 3.12%. In period 2, its average growth rate fell to 1.19%, representing a drop of 1.93%.
Meanwhile, in period 1, the region’s growth rate was about 0.054%.
In period 2, its average growth rate increased to 2.54%, representing an increase of about 2.48%.
Overall, Argentina’s change in growth rate was 4.41% lower than the change in the regional average, signaling poor relative economic performance. To be clear, the deleterious effects of war do not have to reveal themselves as negative growths. In this case, conflict could manifest as a dampening effect on economic growth.
Nicaragua in 1982:
Primer:
In 1979, the Sandinista National Liberation Front overthrew the government of Nicaragua. Starting from 1981, the US attempted to destabilize the leftist government by secretly arming, training, and funding the Contras. The CIA distributed manuals like “Psychological Operations in Guerilla War,” advising Contras to bomb public buildings, assassinate judges, and terrorize civilian populations. Another such manuscript is “The Freedom Fighter’s Manual,” (a strong recommended reading) which provided pictured instructions to call in sick to work as an act of defiance and to craft Molotov cocktails. US involvement ended in 1989.
This is yet another example of a US intervention that was explicitly anti-democratic. Notably, this is the only instance out of all of the countries we observe where the attempted regime change failed. That is, the US was not able to topple the government of Nicaragua.
We compare Nicaragua to average Central American growth rates (Belize, Costa Rica, El Salvador, Guatemala, Honduras, and Panama).
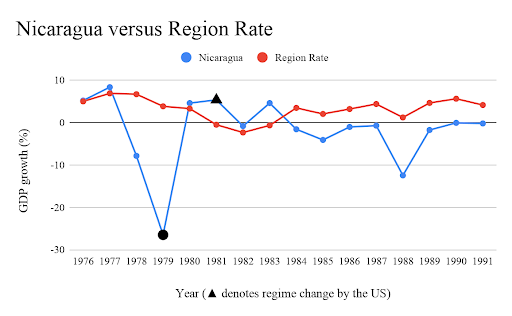
Note: Data for Nicaraguan and regional growth rate from World Bank (2019) | Graph by Jeffrey Suzuki
Graph in context:
Before the US attempts to destabilize the Nicaraguan government in 1981, there is a precipitous drop in growth in 1979. Considering that the rise of the Sandinistas proved a costly and bloody affair, it is sensible that there is a large drop in 1979. What is unclear is whether US intervention had any meaningful effect on economic growth after 1981.
Relative Performance of Nicaragua compared to the Region:
We measure relative performance by observing changes in average growth rates in our observed country and the regional average.
In period 1, Nicaragua average growth rate was about -3.23%.
In period 2, its average growth rate increased to -1.15%, representing an increase of 2.08%.
Meanwhile, in period 1, the region’s growth rate was about 5.16%.
In period 2, its average growth rate fell to 2.3%, representing a decrease of about 2.855%.
Overall, Nicaragua’s change in growth rate was 4.935% higher than the change in regional average, signaling high relative economic performance.
Even though Nicaragua did well economically relative to its region, we cannot interpret these results seriously, considering the fact that the country and region were incomparable by the time American intervention took place. Even though Nicaragua’s situation improved after the start of American intervention, the Latin American country was already severely war-torn to begin with. In reality, Nicaragua endured a highly devastating conflict, and then the American government imposed a moderately devastating war, evidenced by negative growth rates in both periods. It is entirely possible that Nicaragua’s economic growth improved in spite of US intervention.
Grenada in 1983:
Primer:
The People’s Revolutionary Army (PRA) of Grenada overthrew the government of Grenada in a revolution in 1979, beheading the prime minister. The situation changed rapidly, and the leaders of the armed takeover were executed. Hudson Austin, former general of the PRA, assumed the position of chairman of the new military government. The US invaded Grenada in Operation Urgent Fury to remove the People’s Revolutionary Government and helped enforce free elections in 1984. Since then, Grenada has remained a relatively stable and uncorrupt democracy. This intervention was considered a success by none other than Grenadans themselves; Grenada’s version of Thanksgiving celebrates the day American and allied forces invaded their country to oust the revolutionary government. Of course, support for the invasion was not universal. This could be considered an example of a US intervention that successfully established a democratic government.
We compare Grenadan growth rates to average Caribbean growth rates (Antigua and Barbuda, the Bahamas, Barbados, Cuba, Dominica, Dominican Republic, Haiti, Jamaica, Saint Kitts and Nevis, Saint Lucia, Saint Vincent and the Grenadines, and Trinidad and Tobago).
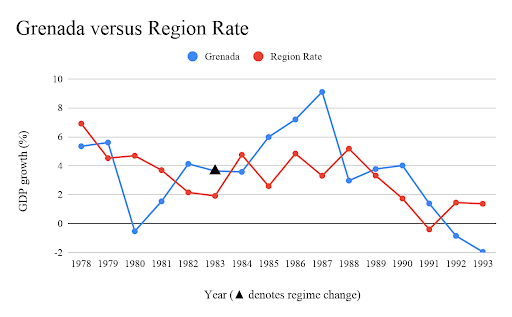
Note: Data for Grenadan and regional growth rate from World Bank (2019) | Graph by Jeffrey Suzuki
Graph in context:
We can observe a clear decline starting from 1979, similar to the Nicaraguan situation before their attempted regime change. However, a notable difference is that American intervention actually succeeded in instating a relatively stable democracy.
Relative Performance of Grenada compared to the Region:
We measure relative performance by observing changes in average growth rates in our observed country and the regional average.
In period 1, Grenada’s average growth rate was about 3.21%.
In period 2, its average growth rate increased to 3.53%, representing an increase of 0.32%.
Meanwhile, in period 1, the region’s growth rate was about 4.39%.
In period 2, its average growth rate fell to 2.73%, representing a decrease of about 1.66%.
Overall, Grenada’s change in growth rate was 1.98% higher than the regional average, signaling high relative economic performance.
We observe the same issues with Grenada with we did in Nicaragua: the regional average is incomparable with the Grenadan average pre-American intervention because of large economic fluctuations.
Nevertheless, we can observe that the Grenadan economic growth exceeds the regional rate for four consecutive years after American intervention, a possible effect from the stabilizing effects of of occupying forces immediately after the success of Operation Urgent Fury.
Panama in 1989:
Primer:
The U.S. overthrew the military dictatorship of Manuel Noriega and placed Guillermo Endara, the rightful winner of the 1989 presidential elections, in office. The transition to democracy in Panama was a direct result of U.S. intervention. Panama has sustained democratic rule since 1989, including the election of two presidents from Noriega’s former party. This could be considered an example of a US intervention that successfully established a democratic government.
We compare Panama’s growth rates to average Central American growth rates (Belize, Costa Rica, El Salvador, Guatemala, Honduras, and Nicaragua).
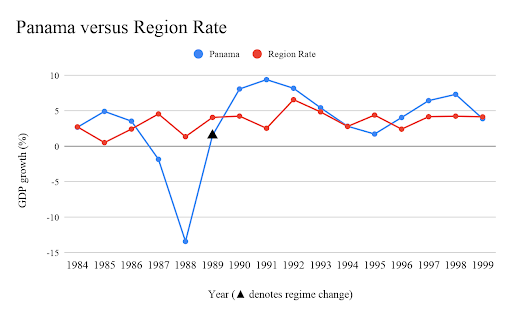
Note: Data for Panamanian and regional growth rate from World Bank (2019) | Graph by Jeffrey Suzuki
Graph in context:
There is a sharp drop two years prior to the American invasion of Panama in 1989. Importantly, the political situation in Panama had begun to rapidly deteriorate in 1988—mass protests and blackouts hit the streets.
The US invasion would last a little more than a month, which may explain why destruction from the invasion does not seem to appear at first glance.
Relative Performance of Panama compared to the Region:
We measure relative performance by observing changes in average growth rates in our observed country and the regional average.
In period 1, Panama average growth rate was about -0.79%.
In period 2, its average growth rate increased to 5.38%, representing an increase of 6.17%.
Meanwhile, in period 1, the region’s growth rate was about 2.35%.
In period 2, its average growth rate increases to 4.07%, representing an increase of about 1.72%.
Overall, Panama’s change in growth rate was 4.45% higher than the change in regional average, signaling high relative economic performance.
The situation in Panama was similar to that of Grenada’s: a rapidly deteriorating economic situation seems to appear in the data prior to the regime change. Later, American troops invade and occupy the area, seemingly restoring peace for a few years.
Haiti in 1994:
Primer:
Before the 1994 regime change in Haiti, there was a coup in 1991. The Armed Forces of Haiti deposed the legitimately elected President Jean-Bertrand Aristide. Coup leaders Philippe Biamby And Michel Francois received military training in the US. The CIA had FRAPH leader Emmanuel (Toto) Constant on its payroll after the coup. While it is unclear whether the CIA actively attempted to orchestrate the coup, it is clear that they trained and paid some of its participants. However, for simplicity’s sake, we will assume that the US did not intervene in this case, since there is not enough definitive proof or clear motivation for the US to support this regime change actively.
In 1994, the US restored President Jean-Bertrand Aristide was restored to power in Operation Uphold Democracy. This is an example of a US intervention that helped establish a democratic government.
We compare Haiti’s growth rates to the Caribbean regional average (Antigua and Barbuda, the Bahamas, Barbados, Cuba, Dominica, Dominican Republic, Panama, Grenada, Jamaica, Saint Kitts and Nevis, Saint Lucia, Saint Vincent and the Grenadines, and Trinidad and Tobago).
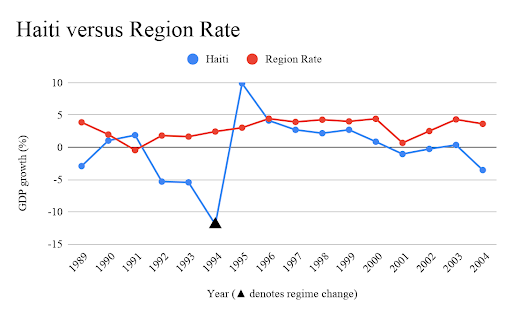
Note: Data for Haitian and regional growth rate from World Bank (2019) | Graph by Jeffrey Suzuki
Graph in context:
Considering the decline of the Haitian economy from 1990-1994 and the immediate recovery starting from 1994, it appears that the graph supports narrative that the US restoring democracy by reinstating President Aristide facilitated recovery.
Relative Performance of Haiti compared to the Region:
We measure relative performance by observing changes in average growth rates in our observed country and changes in the regional average.
In period 1, Haiti’s average growth rate was about -2.15%.
In period 2, its average growth rate increased to 0.55%, representing an increase of 2.7%.
Meanwhile, in period 1, the region’s growth rate was about 1.78%.
In period 2, its average growth rate increased to 3.43%, representing an increase of about 1.65%.
Overall, Haiti’s change in growth rate was 1.05% higher than the regional average, signaling high relative economic performance. It is important to note that this Haitian government would fall victim to a coup only a decade later in 2004.
What does this mean?
We can actually observe that there are, unsurprisingly, visible declines in growth before the US government intervenes. Out of our six interventions above, Argentina is the only one that does not appear to radically decline relative to the regional average before American intervention. As for the other five, a declining economic situation may signal political instability before the time of the regime change; perhaps both simultaneously cause the regime change to occur.
Regarding the actual impact of interventions, Grenada, Haiti, and Panama all had higher rates of growth post-intervention. It also happens to be the case that these were all pro-democratic regime changes. Meanwhile, all of the anti-democratic regime changes had negative growth rates after intervention. Perhaps spreading democracy is better economically than anti-democratic regime change as far as interventions go.
We considered a formal difference-in-difference methodology. However, we found that pre-regime change rates are often radically different from the regional rates; for example, Nicaragua, where pre-regime change numbers are not remotely comparable. We cannot assume parallel trends in good faith.
There are three main reasons why we cannot draw a causal relationship. First, reverse causality is a concern; economic decline and political instability are both linked with US intervention. The US intervened when circumstances became unstable, rather than causing instability through intervention. In every case besides Argentina, economic growth of countries fluctuated more than the economic growth of regions, possibly signaling political instability before the time of regime change. The US may have merely helped “pick winners”—select those who prevail during a coup—when circumstances became politically unstable. In other words, if a country’s political and/or economic situation was already deteriorating, the US decided it might as well support the rise of pro-US leaders. Therefore, negative economic effects may have occurred regardless of American intervention.
Secondly, we do not account for neighboring political circumstances. For example, the Chilean coup of 1973 occurred before the Argentine coup and can be seen in our data. Therefore, our assumption that the US does not intervene in neighboring countries is inconsistent with our data.
Thirdly, we do not account for possible externalities from American meddling, as surrounding Latin American countries may see nearby intervention as intimidating and may behave differently than otherwise. For example, Latin American countries may elect leaders or adopt policies more attuned to US interests after a neighboring country is invaded or tampered with, which may impact economic growth either positively or negatively. Additionally, refugees, weapon sales, and other possible factors change the economic growth of the region.
What does this mean for American democratic peace theorists?
Advocates of democratic peace theory should be wary of the fact that in half of the time the US has attempted regime change in the six cases we observed, only half of them attempted to spread democracy. Out of three successful interventions, two (interventions in Panama and Grenada) succeeded in creating a stable, long-lasting democracy. Therefore, characterizing the United States as a bastion of freedom that spreads democracy and lasting peace where it goes would be, at best, a naive characterization. Rather, the US can either be considered a fickle supporter of democracy, or a realist country simply acting in its own political and commercial self-interest—a legacy of Dollar Diplomacy.
This article is by no means a rejection of the theory. It could very well be the case that a world populated with democracies would be more peaceful than one that is not. However, considering the number of anti-democratic American interventions around the world, we can at least credibly say that American leaders have not been as faithful to proselytizing the word of democracy as they claim in their rhetoric.
To quote an eloquent hero of American conservatives:
“Countries across the globe are turning to free markets and free speech and turning away from the ideologies of the past. For them, the great rediscovery of the 1980s has been that, lo and behold, the moral way of government is the practical way of government: Democracy, the profoundly good, is also the profoundly productive.”
— Ronald Reagan in his farewell address
But his administration was responsible for supporting the Contras to destabilize Nicaragua, a sovereign democratic state. Democratic peace theory perhaps has not been used to spread democracy in good faith; rather, it may be yet another justification for war to obscure the self-serving nature of American foreign policy. Therefore, advocates should be wary of the next president who launches a war thousands of miles away in the name of liberating a people and establishing a state in its name.
Footnotes:
1, 2, and 3. John J. Mearsheimer, The Great Delusion: Liberal Dreams and International Realities, pp. 154.
4. Mearsheimer, The Great Delusion: Liberal Dreams and International Realities, pp. 195-216
5. Mearsheimer, The Great Delusion: Liberal Dreams and International Realities, pp. 179
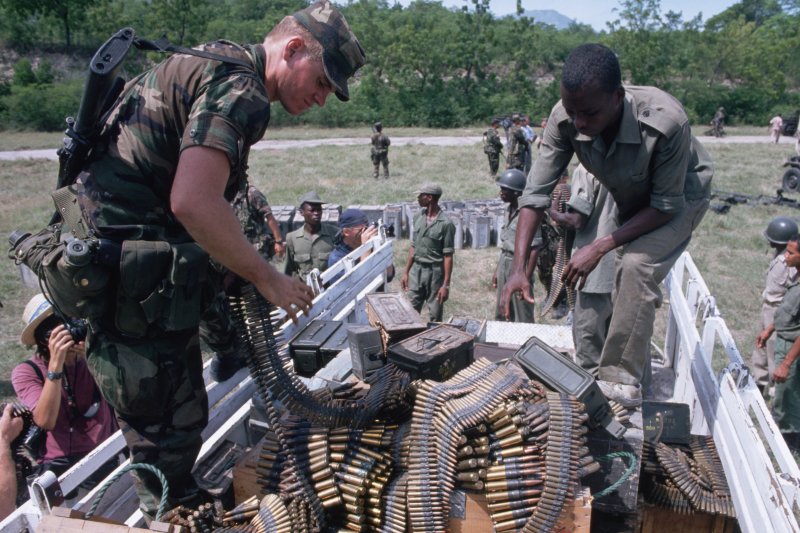
Featured Image Source: TIME
Disclaimer: The views published in this journal are those of the individual authors or speakers and do not necessarily reflect the position or policy of Berkeley Economic Review staff, the Undergraduate Economics Association, the UC Berkeley Economics Department and faculty, or the University of California, Berkeley in general.


One thought on “Crusading for Democracy in Latin America”